How festive is the UK?
A daily festivity index for the nation, measured by Google searches for "All I Want for Christmas Is You".
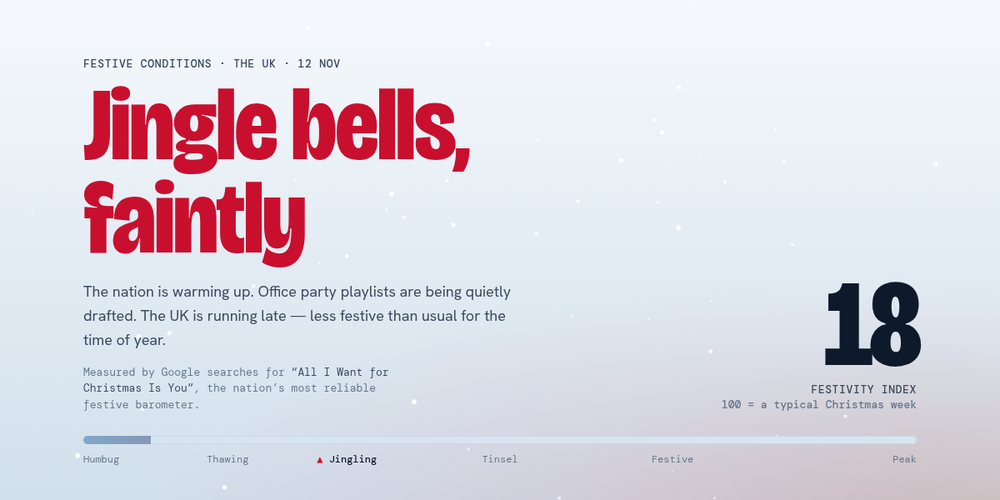
Every year, Google searches for All I Want for Christmas Is You climb as Christmas gets closer. That makes them a surprisingly reliable festive barometer. This site turns them into a daily verdict on how festive the UK is feeling, from Bah humbug to Peak Christmas.
What it shows
- The Festivity Index. Search interest over the last 7 days, as a percentage of an average past Christmas peak. 100 means a typical Christmas week.
- How this year compares with the same date last year and with the 5-year average.
- Festive lift-off. The first day of the season that searches reached 10% of a typical peak.
- Every Christmas, overlaid. A chart of every season since 2021, with this year in red.
How it works
A Python script uses pytrends to pull five years of weekly data and the last 90 days of daily data from Google Trends. Trends normalises every request to its own 0–100 scale, so the daily figures are rescaled onto the weekly scale with a least-squares fit over the weeks the two series share.
A GitHub Actions workflow runs the script every morning, commits the new data, and publishes the static site to GitHub Pages. Each day’s raw responses are archived, so seasons that fall out of Google’s 5-year window are kept for good. Google Trends has no official API, so the script retries with back-off, and if a run still fails the site keeps showing the previous day’s data.